
Subprime Credit Card Delinquency Data Is Not Your Portfolio. Here Are the Three Numbers That Are.
Last updated: September 2026
National credit card delinquency data does not describe your borrower.
In Q2 2026 the 30-day-plus delinquency rate on credit cards at U.S. commercial banks fell to 2.85%, down from 3.04% a year earlier and 3.22% two years earlier, and prime-rated cardholders 60 days late came in at 0.84%.
Those readings measure people who still hold open, unused credit lines, which is the exact population that never walks into a subprime loan store.
The numbers that describe your paper are your own, and there are three of them: first payment default rate, ACH return rate, and roll rate, each measured by funding cohort.
If you tightened underwriting this summer because a talking head said the consumer is collapsing, you starved your own fundings for nothing.
If you loosened because a different one said the consumer is resilient, your charge-offs will find you by Q1.
Either way you let cable news run your loan book.
Take it back.
Get the numbers before the commentary.
Free Industry Newsletter: Four issues a month for payday lenders, car title lenders, installment lenders, Texas CAB operators, online lenders, attorneys, processors, LMS providers, capital sources, and industry insiders. 5,000+ operators already read it.
TL;DR
- National card delinquency data improved again in Q2 2026: 2.85% at 30+ days past due at commercial banks, versus 3.04% a year ago.
- Prime cardholders 60+ days late hit 0.84%, and that low number pulls the whole average down.
- U.S. households are sitting on a record $4.30 trillion of unused credit lines. Your borrower owns almost none of it.
- Card data measures people who still have credit available. Your applicant has none, which is why they are on your counter.
- Underwrite off first payment default, ACH return rate, and roll rate, by cohort. Not off a national average.
Decision Path
Pull your last 90 days of first payment defaults by funding week. If the trend is up, tighten now, not in Q1.
Pull your ACH return rate by reason code. Unauthorized returns and administrative returns tell you two different stories.
Pull roll rates by bucket, not blended. A blended number hides the bucket that is actually failing.

Jer Ayles
Trihouse Consulting
20+ years in consumer lending. Built and sold 15 storefront lending locations. Consults lenders, investors, and tribal partners nationwide on payday, car title, installment, and Texas CAB models.
More about Jer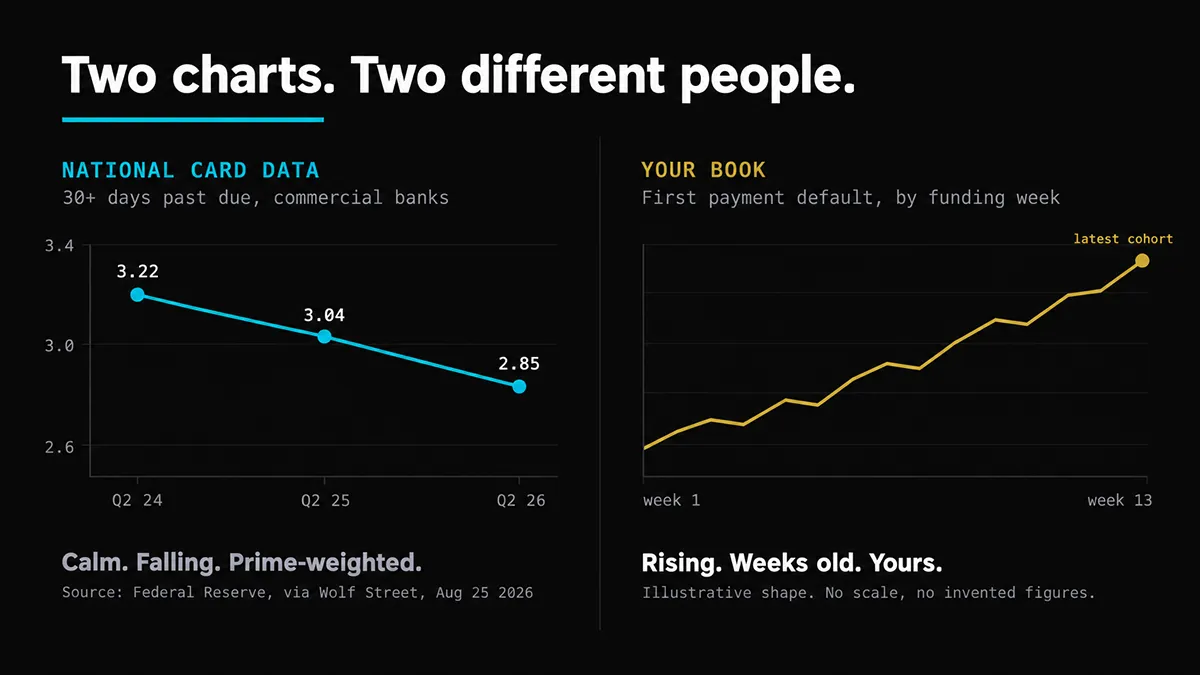
National credit card delinquency chart falling next to a subprime lender portfolio chart rising, showing two different populations
TL;DR
- National card delinquency data improved again in Q2 2026: 2.85% at 30+ days past due at commercial banks, versus 3.04% a year ago.
- Prime cardholders 60+ days late hit 0.84%, and that low number pulls the whole average down.
- U.S. households are sitting on a record $4.30 trillion of unused credit lines. Your borrower owns almost none of it.
- Card data measures people who still have credit available. Your applicant has none, which is why they are on your counter.
- Underwrite off first payment default, ACH return rate, and roll rate, by cohort. Not off a national average.
Decision Path
Pull your last 90 days of first payment defaults by funding week. If the trend is up, tighten now, not in Q1.
Pull your ACH return rate by reason code. Unauthorized returns and administrative returns tell you two different stories.
Pull roll rates by bucket, not blended. A blended number hides the bucket that is actually failing.
What Q2 2026 Actually Said
Here is the data, published August 25, 2026, and here is what each figure measures.
Credit card delinquencies, 30+ days past due at U.S. commercial banks: 2.85%, seasonally adjusted.
That is down from 3.04% a year ago and 3.22% two years ago. Source: Federal Reserve.
All credit cards, 60+ days past due: 2.69%, down from 2.87% a year ago. Source: Equifax.
Prime-rated cardholders, 60+ days past due: 0.84%, the lowest reading since the stimulus era. Source: Fitch Ratings.
Total credit card limits: $5.56 trillion, a record. Balances: $1.26 trillion.
Unused available credit: $4.30 trillion, also a record, up $270 billion year over year.
Card and other consumer debt as a share of disposable income: 7.75%, up slightly from 7.68% a year ago.
Read the last two lines again.
- Limits at a record.
- Unused credit at a record.
- Delinquencies falling.
So everybody is fine?
No. Both camps are reading the wrong dashboard.
Why the Average Hides Your Borrower
Your borrower does not live in the averages.
That 0.84% prime figure is doing enormous work. Prime cardholders are the largest slice of outstanding card accounts, so when they behave, the blended national number falls even if the bottom of the credit box is deteriorating underneath it. The average went down. That does not mean everybody went down with it.
The $4.30 trillion of unused credit belongs to people who will never sit across from you. A borrower with open room on a card does not pay 300%+ APR equivalent for $400 until Friday. They swipe.
Your customer is banked but broke. Employed. Direct deposit hitting on a schedule. Zero room on the card, if there is a card at all.
That is the whole point. National card data measures the people who do not need you. It is a good read on prime household health. It tells you close to nothing about the paper sitting in your book right now.
This is where operators get killed: they treat a macro release as a signal to move the credit box, when the release is describing a different population entirely.
Define It Once:
What “Your Dashboard” Means Plain language, because every reader is a first-time reader somewhere.
Your dashboard is the set of portfolio metrics generated by loans you funded, measured by the week or month you funded them.
Not industry averages.
Not a trade association survey.
Not a Federal Reserve series.
Loans you underwrote, to borrowers you approved, on terms you priced, grouped by when the money went out the door.
Grouping by funding period is what makes it useful.
A blended portfolio number tells you what happened across everything you have ever done.
A cohort number tells you whether the decisions you made six weeks ago were worse than the decisions you made in the spring.
One is a history lesson. The other is a steering wheel.
The Three Numbers That Run Your Loan Book
Three, in this order. Each one is earlier than the one before it is usually reported.
1. First Payment Default Rate (FPD)
What it is: the percentage of loans in a funding cohort where the borrower misses the very first scheduled payment.
Why it comes first: FPD is the fastest read you have on underwriting quality. A charge-off tells you about a decision you made months ago. An FPD tells you about a decision you made weeks ago. When your applicant pool thins out, FPD moves before anything else on your P&L does.
How to pull it: group every funded loan by funding week for the last 13 weeks. For each week, divide the count of loans that missed payment one by the total loans funded that week. Chart the 13 points.
What breaks: operators report FPD blended across the whole portfolio and call it flat. Blended is useless. The signal lives in the slope across cohorts.
2. ACH Return Rate
What it is: the percentage of your debit entries that come back unpaid, broken out by return reason code.
Why it matters twice: it is both a credit signal and an existential payments risk. Rising returns mean your borrowers’ balances are thinner. They also put your ACH origination privileges in play.
The thresholds to know. As of this writing, Nacha sets an unauthorized return rate threshold of 0.5% (return codes R05, R07, R10, R29, R51), an administrative return rate level of 3.0% (R02, R03, R04), and an overall return rate level of 15.0%. The unauthorized threshold is the hard one. The administrative and overall levels are inquiry triggers, meaning crossing them opens a conversation about your origination practices rather than an automatic violation. Nacha rules change. Confirm current thresholds and code lists with your ODFI or processor before you set an internal alarm.
How to pull it: ask your processor for returns by code by month, not a single blended return percentage. Watch R01 (insufficient funds) as a credit signal and the unauthorized family as a compliance signal. They are different problems with different fixes.
What breaks: an operator watches one blended return number, sees it inside a comfortable range, and misses that the unauthorized slice tripled inside it.
3. Roll Rate
What it is: the percentage of dollars in one delinquency bucket that move to the next bucket in the following period. Current to 1-30. 1-30 to 31-60. And so on.
Why it matters: roll rate is where you find out whether your collections operation is actually working, separate from whether your underwriting is working. Two very different fixes.
How to pull it: take the dollar balance in each bucket at month end. Next month end, measure how much of that specific balance moved down one bucket. Chart each transition separately.
What breaks: blending it again. A stable overall delinquency percentage can hide a 1-30 to 31-60 roll rate that jumped ten points, which is your collections floor telling you something before your charge-off line does.
Title Operators, Add a Fourth
If you write car title paper, add redemption rate on repossessed units. It is the cleanest read on whether you are lending against the vehicle or against the borrower. Repossession and disclosure requirements vary sharply by state and change, so confirm current requirements with counsel or your state regulator before you change any repossession practice.
—
Everything above is one chapter of the job. The full operating manual on underwriting, collections, licensing, unit economics, site selection, and the forms that go with them is in the flagship guide. Read what is in it here.
| Question | National card data answers | Your portfolio data answers |
|---|---|---|
| Who is being measured | Cardholders with open accounts, prime-weighted | The borrowers you actually approved |
| How current | Reported with a lag of one quarter or more | As current as last night's file |
| What it moves | Your understanding of the macro picture | Your credit box, pricing, and collections staffing |
| Earliest warning | Charge-offs and delinquency, both lagging | First payment default, weeks after funding |
| Right use | Board context, capital conversations, market sizing | Underwriting decisions |
| Wrong use | Setting your credit box | Arguing about the national economy |
Do This Week: A Four-Step Audit
Export your last 13 weeks of fundings from your loan management system, grouped by funding week, with a flag for whether payment one cleared.
Calculate first payment default by week and chart the 13 points. Look at the slope, not the average.
Request returns by reason code by month from your processor for the last six months. Separate the insufficient-funds family from the unauthorized family.
Build bucket-to-bucket roll rates for the same six months, one transition per line, and compare them against your collections staffing by month.
If the slope on any of the three is moving against you, you have a decision to make this quarter instead of a postmortem next quarter.
Operator Reality Check
Process pitfalls: most loan management systems will export a blended number by default. Blended numbers are the problem. Insist on cohorts.
Compliance risk: ACH return performance is a payments-privilege issue, not only a credit issue. Crossing Nacha levels can put your origination relationship under review.
Margin leaks: tightening the credit box off a macro headline starves fundings you would have collected on. Loosening off one buys charge-offs you have to fund.
Training and documentation: if the person pulling these numbers changes and the definitions are not written down, your trend line breaks and you will not notice for two months.
Results vary: portfolio behavior differs by product, state, channel, and vintage. Nothing here is a guaranteed outcome.
Where Operators Misread Their Own Numbers
Three failure patterns, all common.
They confuse a lagging metric for an early one. Charge-off rate is real, audited, and far too late to act on. By the time it moves, the cohort that caused it was funded two or three quarters ago.
They blend everything. A flat blended delinquency rate can sit on top of one badly deteriorating cohort and one unusually good one. The two cancel out on the report and neither one gets managed.
They change two things at once. Credit box tightened and collections script changed in the same month. Now the metric moved and nobody can attribute it. Change one thing, then measure.
Where to Go From Here
If you read this and realized you do not currently have a clean 13-week first payment default chart, that is the gap, and it is fixable in an afternoon with your LMS export.
If you want a second set of eyes on your actual numbers, book a free 15-minute strategy call and bring them. Not your business plan. Your numbers.
If you want the same thinking available at 2 a.m. when you are staring at a cohort report, Jer’s Lending Desk answers lending questions around the clock, with a free tier to start.
And if you take one thing out of this piece, take the habit: the averages are calm, and your borrower does not live in the averages.
Frequently Asked Questions
Does falling national credit card delinquency mean subprime borrowers are doing better?
Not necessarily. The national figure is weighted toward prime cardholders, whose 60-day delinquency rate hit 0.84% in Q2 2026, and that pulls the blended average down. A falling average is consistent with a stable prime population and a deteriorating subprime one at the same time. The only way to know what is happening to your borrower is to measure your borrower.
What is first payment default rate and why does it matter more than charge-off rate?
First payment default rate is the share of loans in a funding cohort where the borrower misses the first scheduled payment. It matters more as an operating signal because it surfaces weeks after funding, while charge-off rate reports on decisions made months earlier. Charge-off is your scoreboard. First payment default is your smoke alarm.
What ACH return rate should a lender stay under?
As of this writing, Nacha sets an unauthorized return rate threshold of 0.5%, an administrative return rate level of 3.0%, and an overall return rate level of 15.0%. The unauthorized threshold is a hard enforcement trigger; the other two open an inquiry into origination practices rather than an automatic violation. These rules change, so confirm current thresholds with your ODFI or processor rather than relying on a published article.
How often should an operator pull these numbers?
Monthly at minimum for roll rate and ACH returns, weekly for first payment default by cohort. Weekly matters for first payment default because the whole value of the metric is catching a slope change early enough to act on it in the same quarter.
Is $4.3 trillion of unused credit good news for lenders?
For prime lenders, it is a sign of capacity. For subprime operators, it is mostly a reminder of who is not in the pool. A borrower with meaningful open room on a card is generally not your applicant. Available credit concentrated at the top of the credit box does not change demand at the bottom of it.
What should I do if all three numbers are moving against me at once?
Change one thing, then measure. Simultaneous moves on underwriting, pricing, and collections make the result unattributable, and you will spend the next two quarters guessing which change worked. Start with the earliest metric, which is first payment default, and tighten the specific segment driving it rather than the whole credit box.
70 KPIs Top Subprime Lenders Track
The full metric list, once you have the three in this post running.
Loan Charge-Off Rate, Defined
What your lagging scoreboard metric actually measures, and what it cannot tell you.
Underwriting Subprime Loans in 2026
Where to tighten first when first payment default starts sloping the wrong way.
Collections Workflows Playbook
The step-by-step build for the operation your roll rate is grading.
—
This content is general business education, not legal, licensing, or compliance advice. Lending laws, rate caps, repossession requirements, and payments network rules vary by state and by network and change without notice. Confirm current requirements with a licensed attorney, your state regulator, your ODFI, or your processor before acting. Nothing here is a guarantee of a financial outcome. Lending carries real financial risk.
Written by Jer Ayles | 20+ years in consumer lending | Built and sold 15 storefront lending locations | About
Sources: Wolf Street, “Credit Card Delinquencies, Payment Volume, Balances, Debt-to-Income, and Credit Limits in Q2 2026,” August 25, 2026, citing Federal Reserve, Equifax, and Fitch Ratings data. Nacha, ACH Network Risk and Enforcement Topics.
—